 antv-g2Plot
G2Plot 是一套简单、易用、并具备一定扩展能力和组合能力的统计图表库,基于图形语法理论搭建而成
- G2 作为底层依赖,使用了图形语法,上手成本相对较高,功能强大。
- G2Plot 全面依赖 G2,G2Plot 层仅仅是基于 G2 强大的图形、交互、事件、动画能力,一图一做的扩展不同的常见业务图表,开箱即用、易于配置。
- Ant Design Charts 是 G2Plot 的 React 版本,基于 React 封装了 G2Plot,无需感知destroy()、update() 等函数,只需关系 data 和 config,功能和 G2Plot 保持一致,回到第一张图,Ant Design Charts 不局限于 G2Plot,目前已经在 G6 的基础封装了部分流程图、组织架构图等,后续还会接入 L7 (地理可视化) 等图表库。
- G2Plot、Ant Design Charts 都有透出 G2 ,可以简单理解成能力上是对齐的。
# 简介
# 使用方法
- 创建图表实例
import { Line } from "@antv/g2plot";

const line = new Line(container, options);
1
2
3
2
3
- 渲染数据
plot.render();
1
- 更新数据
plot.update(options);
1
# 图标实例
- 折线图 (opens new window)
- 柱状图 (opens new window)
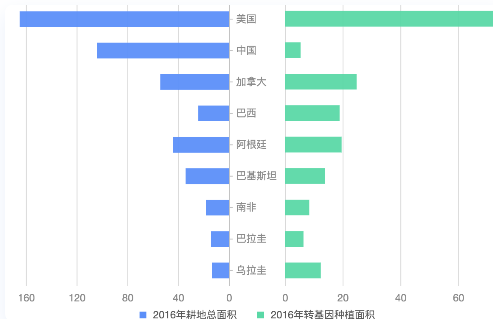
- 条形图 (opens new window)
- 饼图 (opens new window)
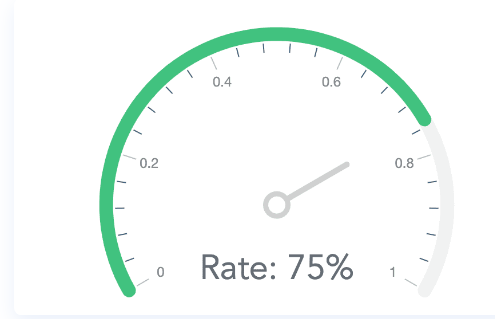
- 仪表盘 (opens new window)
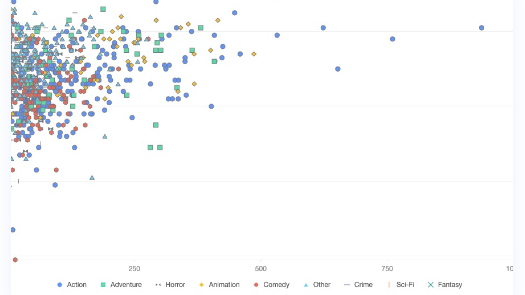
- 散点图 (opens new window)
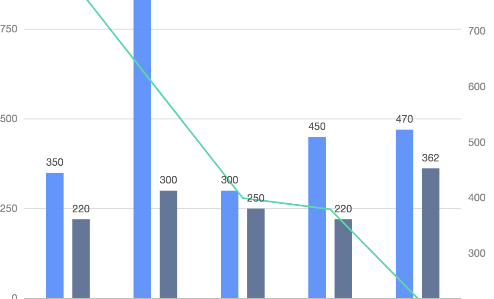
- 双轴图 (opens new window)
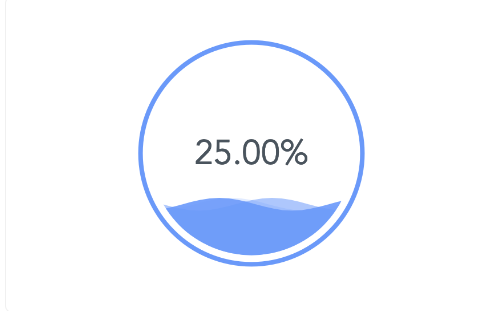
- 水波图 (opens new window)
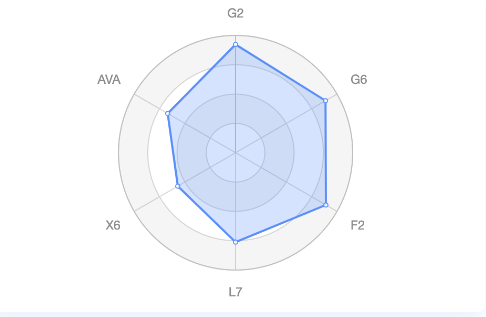
- 雷达图 (opens new window)
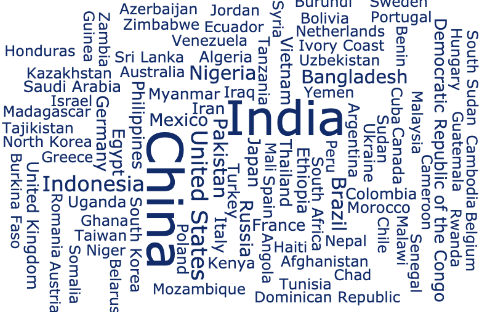
- 词云图 (opens new window)
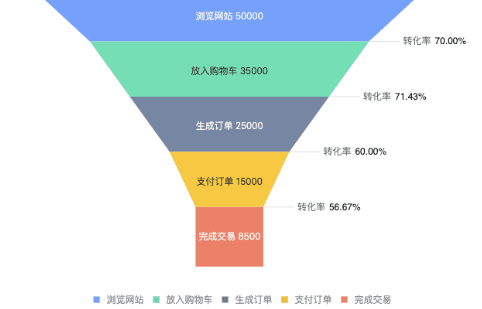
- 漏斗图 (opens new window)
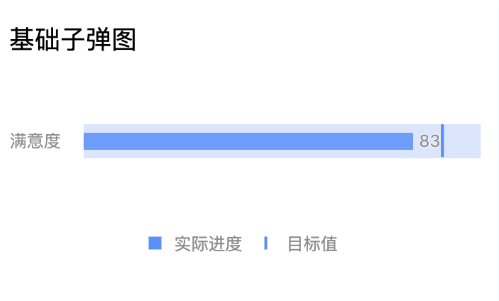
- 子弹图 (opens new window)
- 直方图 (opens new window)
- 玫瑰图 (opens new window)
- 迷你折线图 (opens new window)
- 迷你面积图 (opens new window)
- 迷你柱形图 (opens new window)
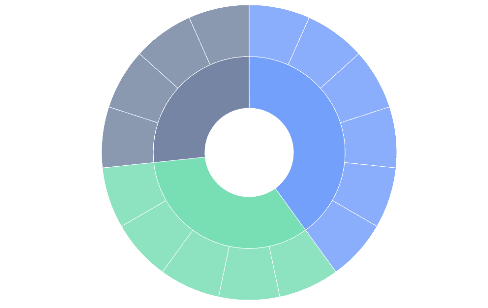
- 旭日图 (opens new window)
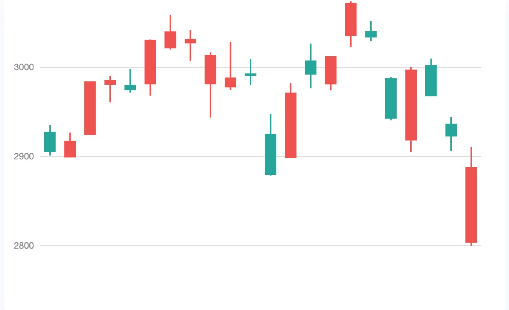
- 股票图 (opens new window)
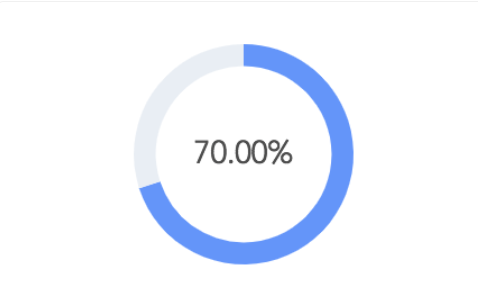
- 进度环图 (opens new window)
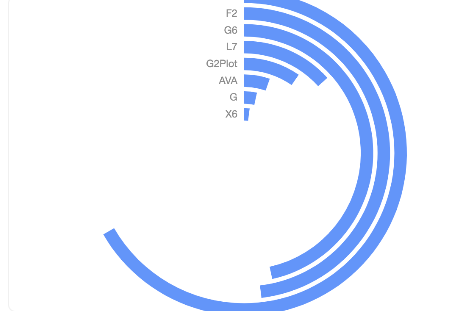
- 进度条图 (opens new window)
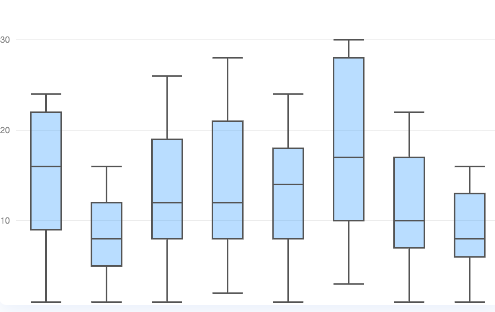
- 箱型图 (opens new window)
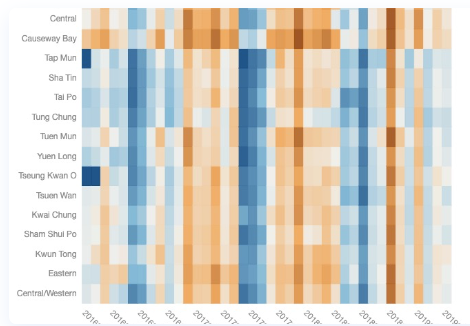
- 热力图 (opens new window)
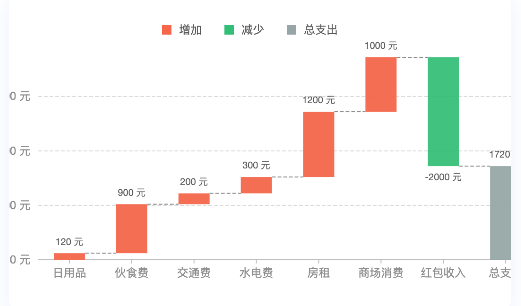
- 瀑布图 (opens new window)
- 玉珏图 (opens new window)
- 对称条形图 (opens new window)
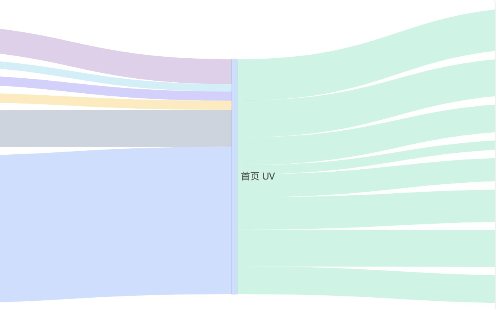
- 桑基图 (opens new window)
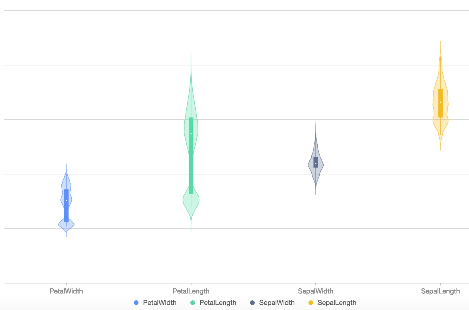
- 小提琴图 (opens new window)
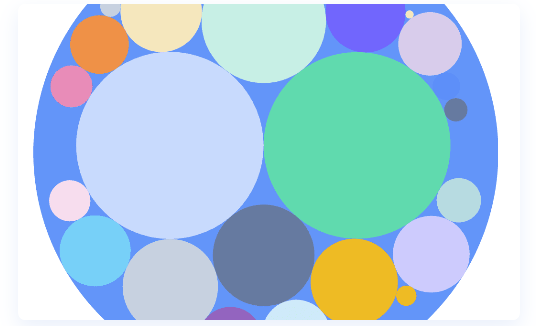
- Circl packing (opens new window)


上次更新: 2024/01/18, 10:44:15